My master's thesis. I wanted to build the tool I'd want if I were an analyst at Barça: pick a match or a player and get the full picture in a few clicks, without touching the raw data.
What it does
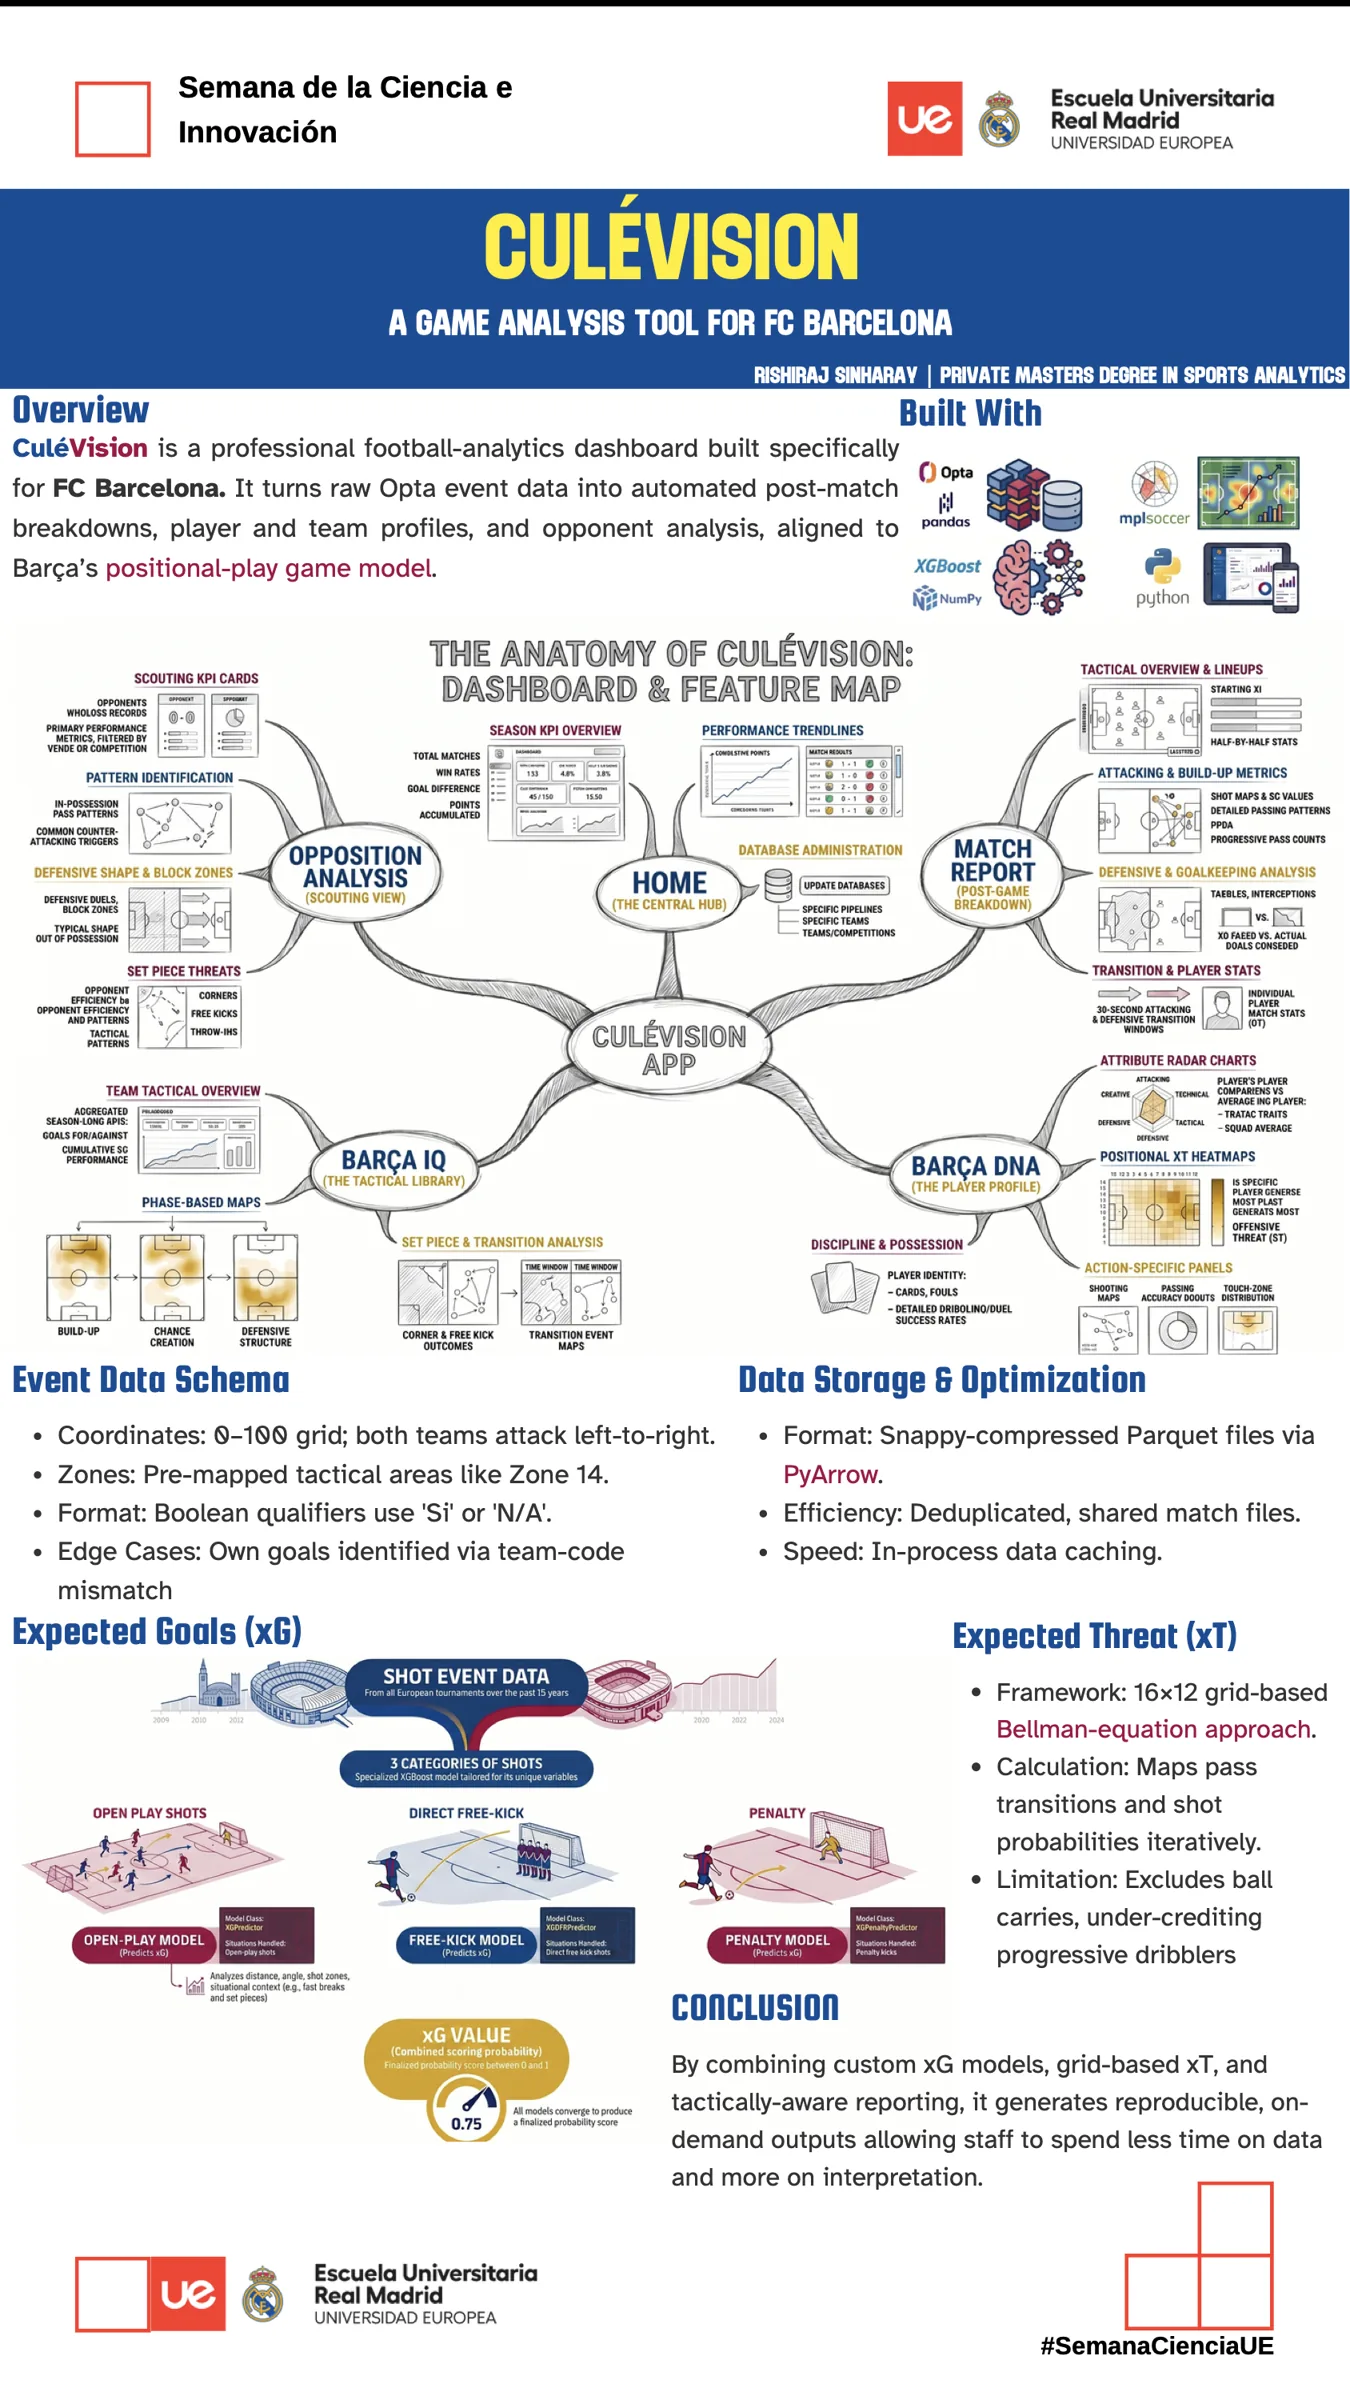
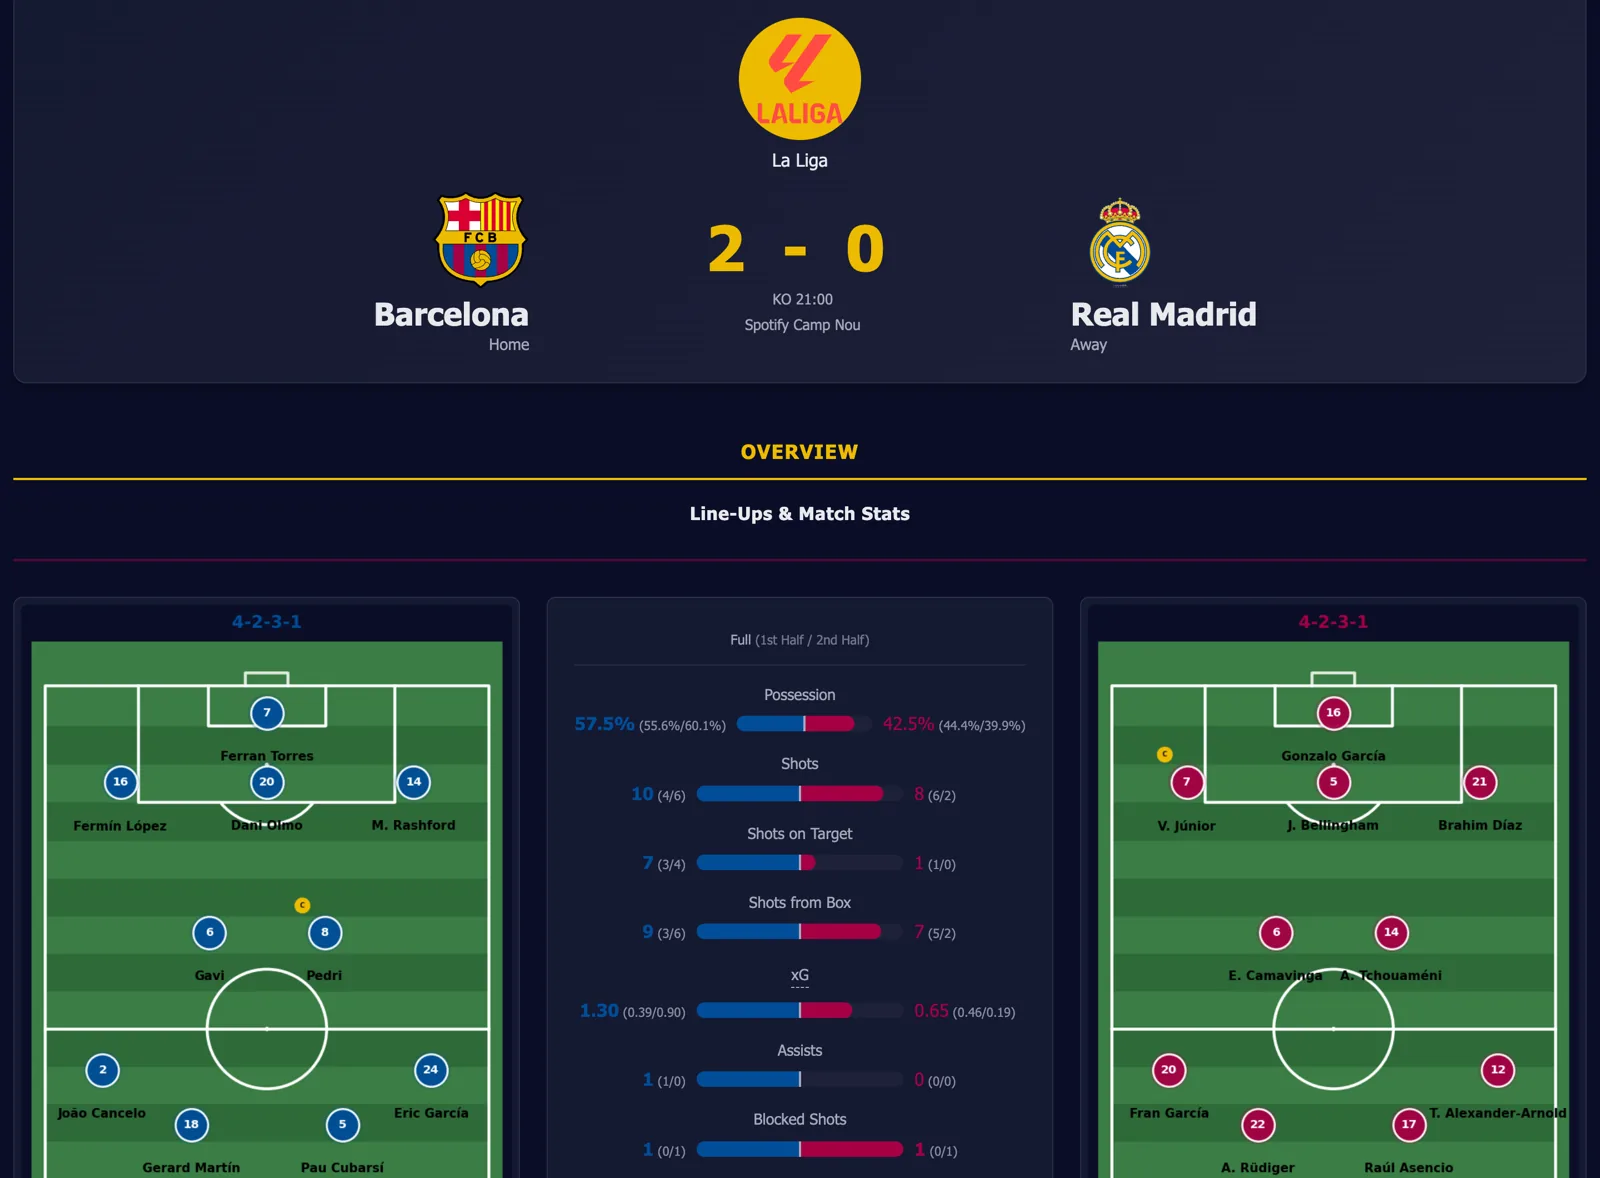
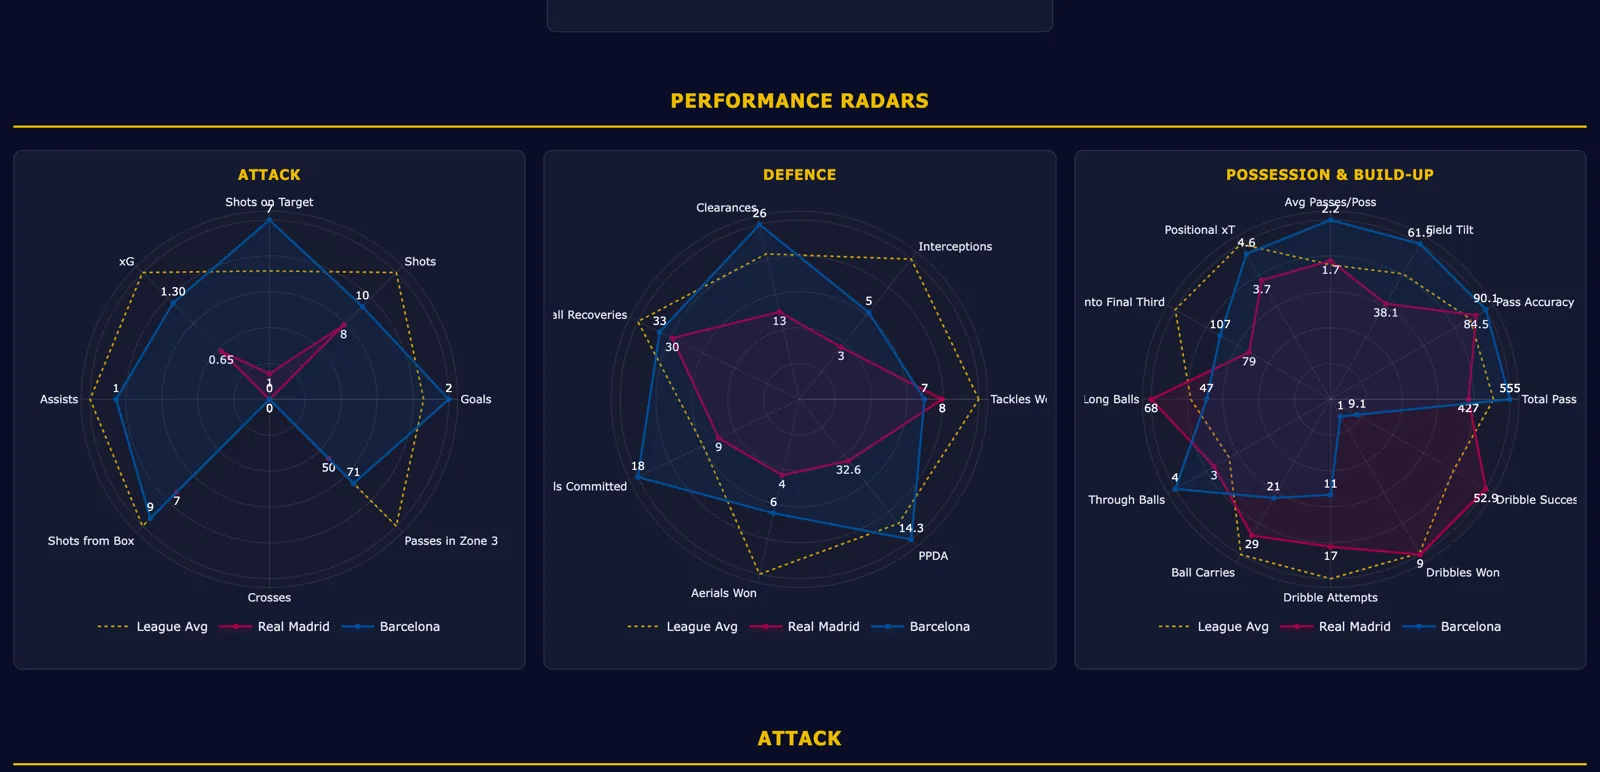
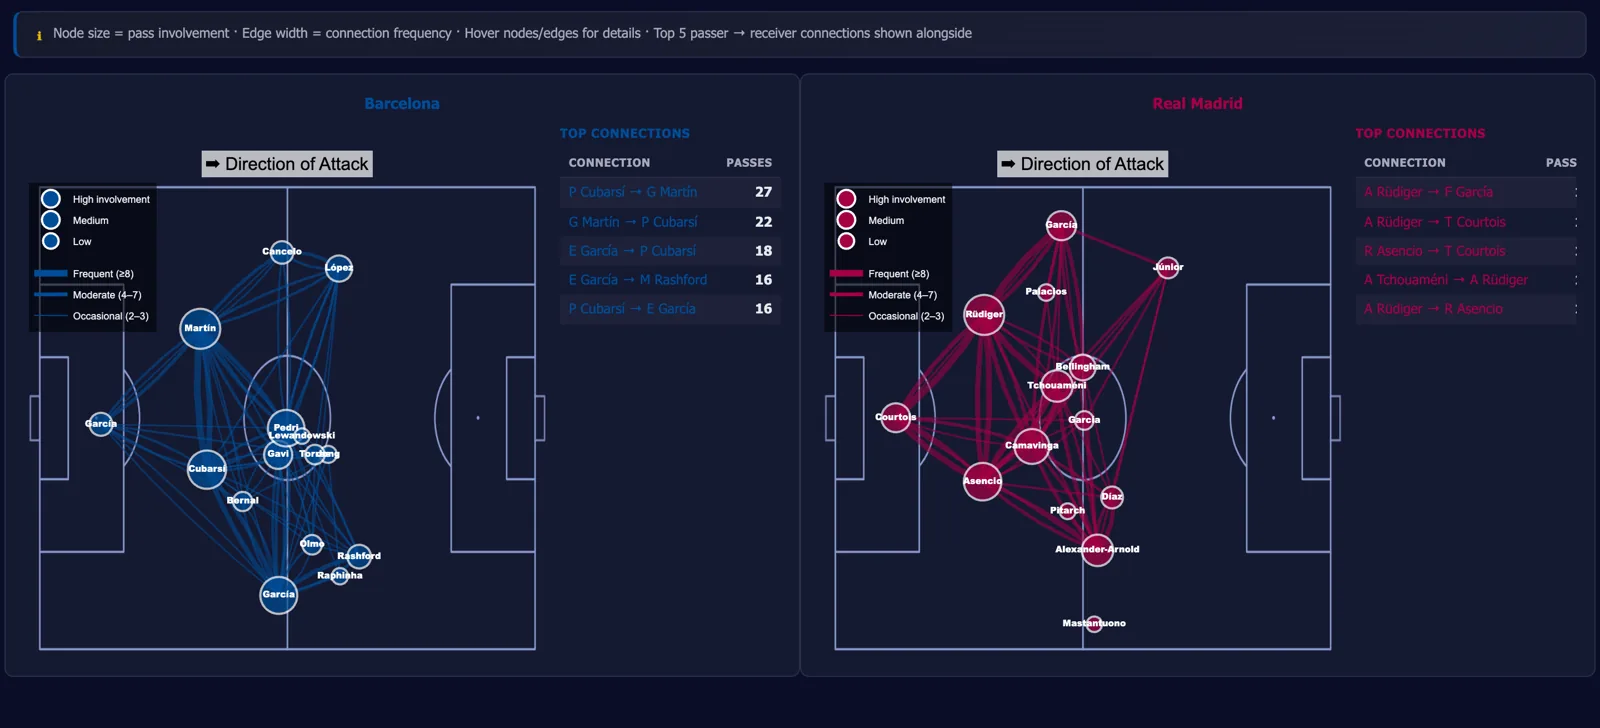
- Match report. Pick a game from the calendar and get a full post-match breakdown: line-ups, half-by-half stats, shot maps, pass networks, Zone 14 entries, transitions and goalkeeping. One click turns it into a PDF.
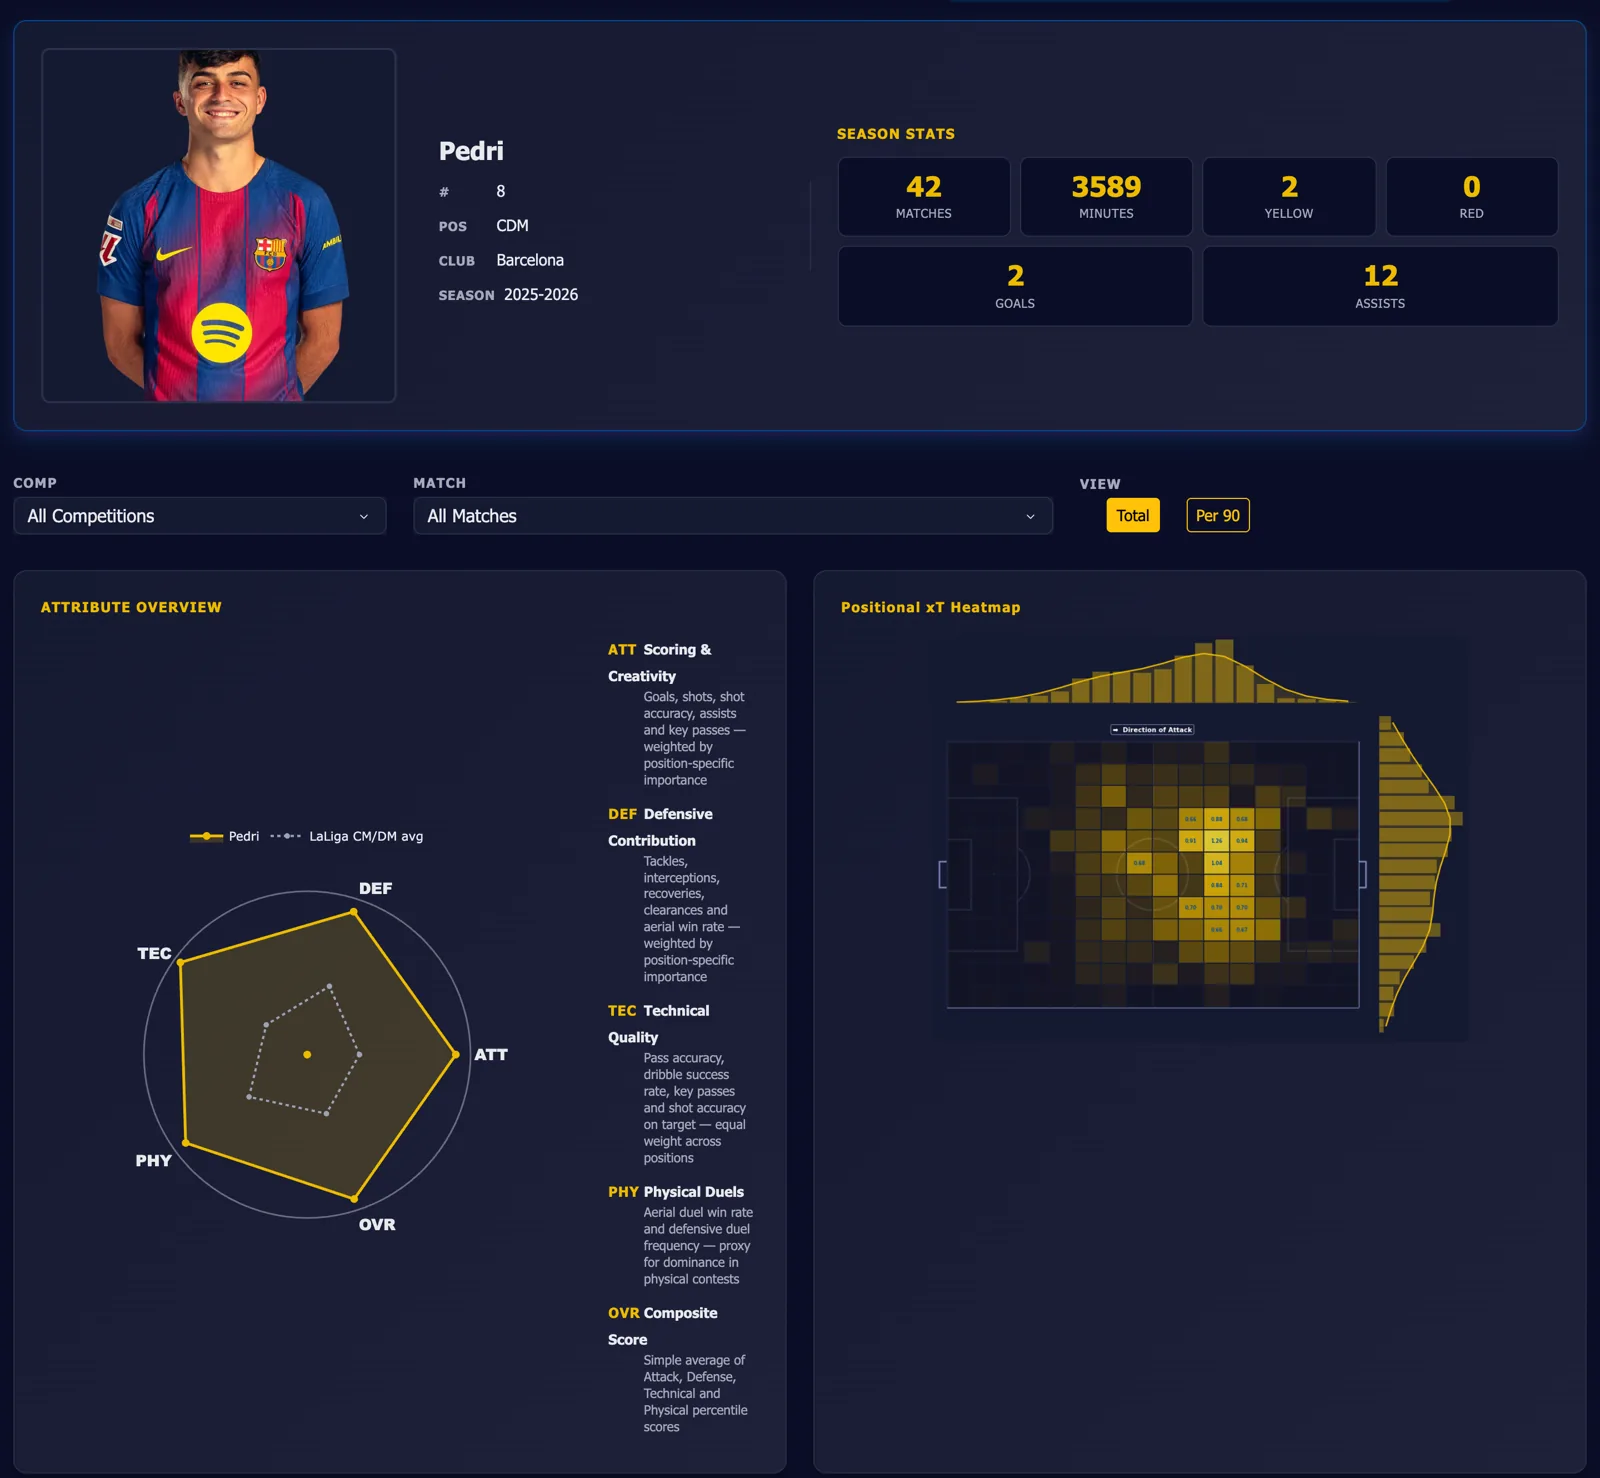
- Player analysis. Any player in the database gets a radar against the league average for their position, a heatmap of where they add threat, and their shooting, passing, possession and defending numbers.
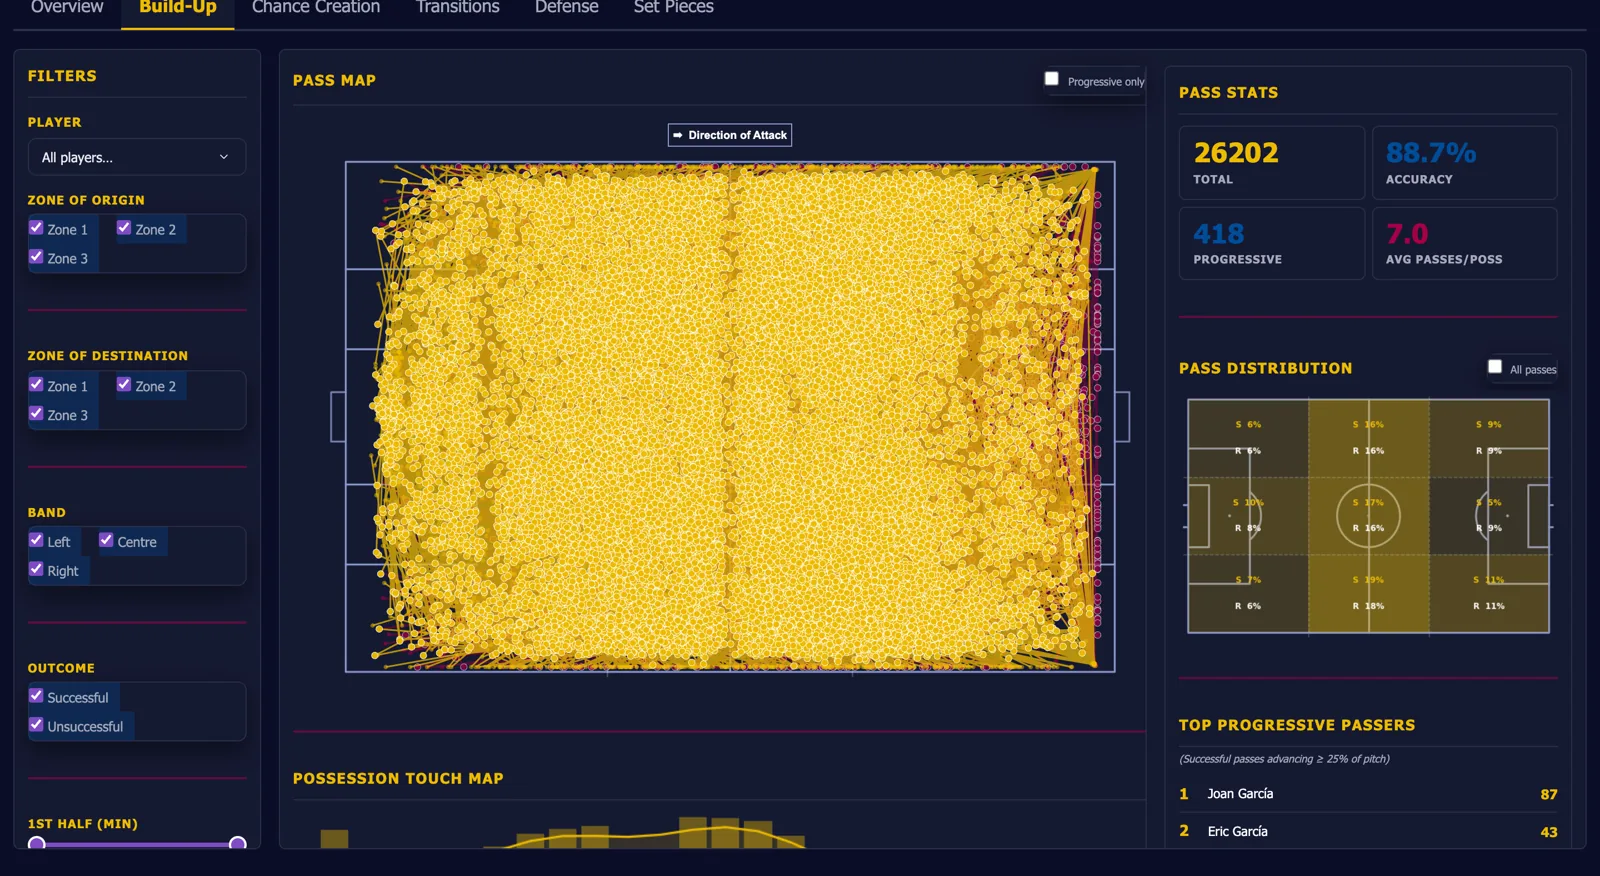
- Team analysis. Barça or any of the 30 rivals, through the same lens: build-up, chance creation, transitions, defence and set pieces. Same metrics both ways, so scouting an opponent and reviewing ourselves line up.
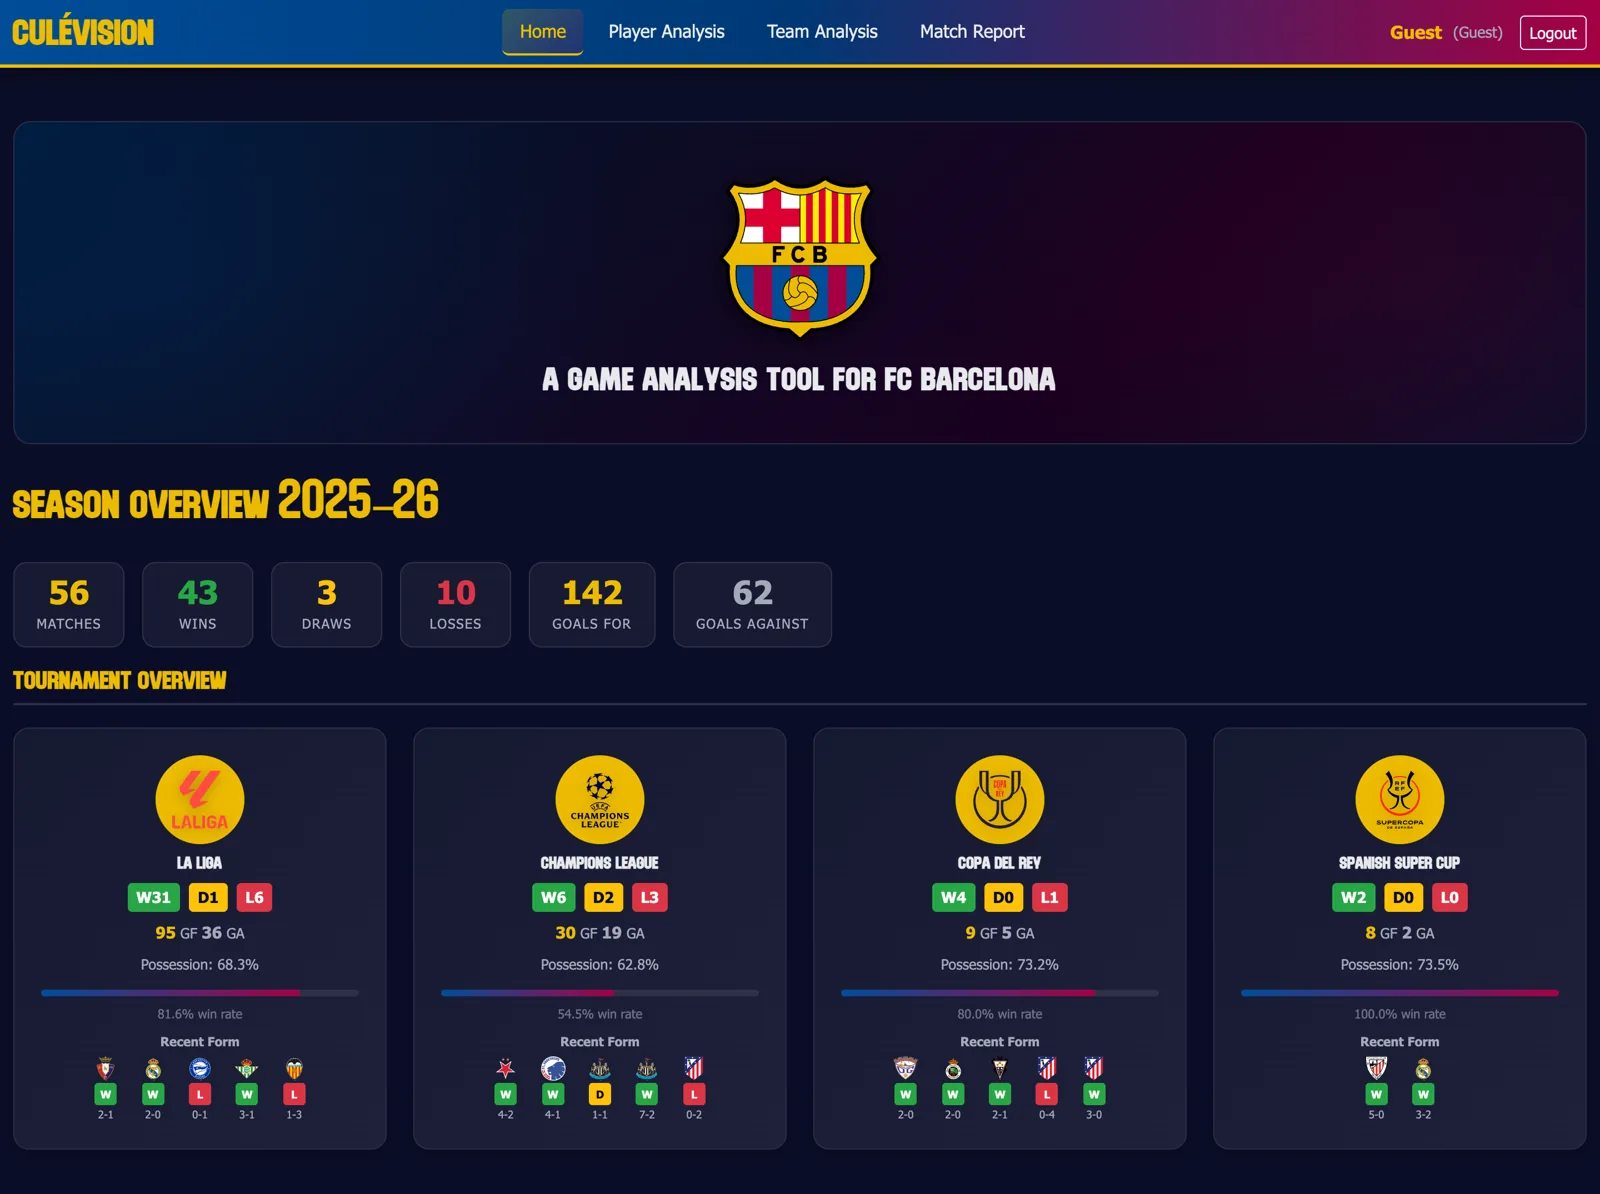
- Season overview. Record per competition, recent form, a points trendline and the top contributors.
Under the hood
- A pipeline pulls Opta event data for 31 teams across 21 competitions and stores every match as Parquet. Re-running it only fetches new games.
- xG comes from three XGBoost models, one each for open play, direct free kicks and penalties, trained on historical Wyscout shots.
- xT is a 16×12 grid model. Opta has no carry events, so it undersells players who dribble the ball forward.
- Runs on Google Cloud Run with the data in Cloud Storage. The screenshots are from the app running on the 2025–26 season.