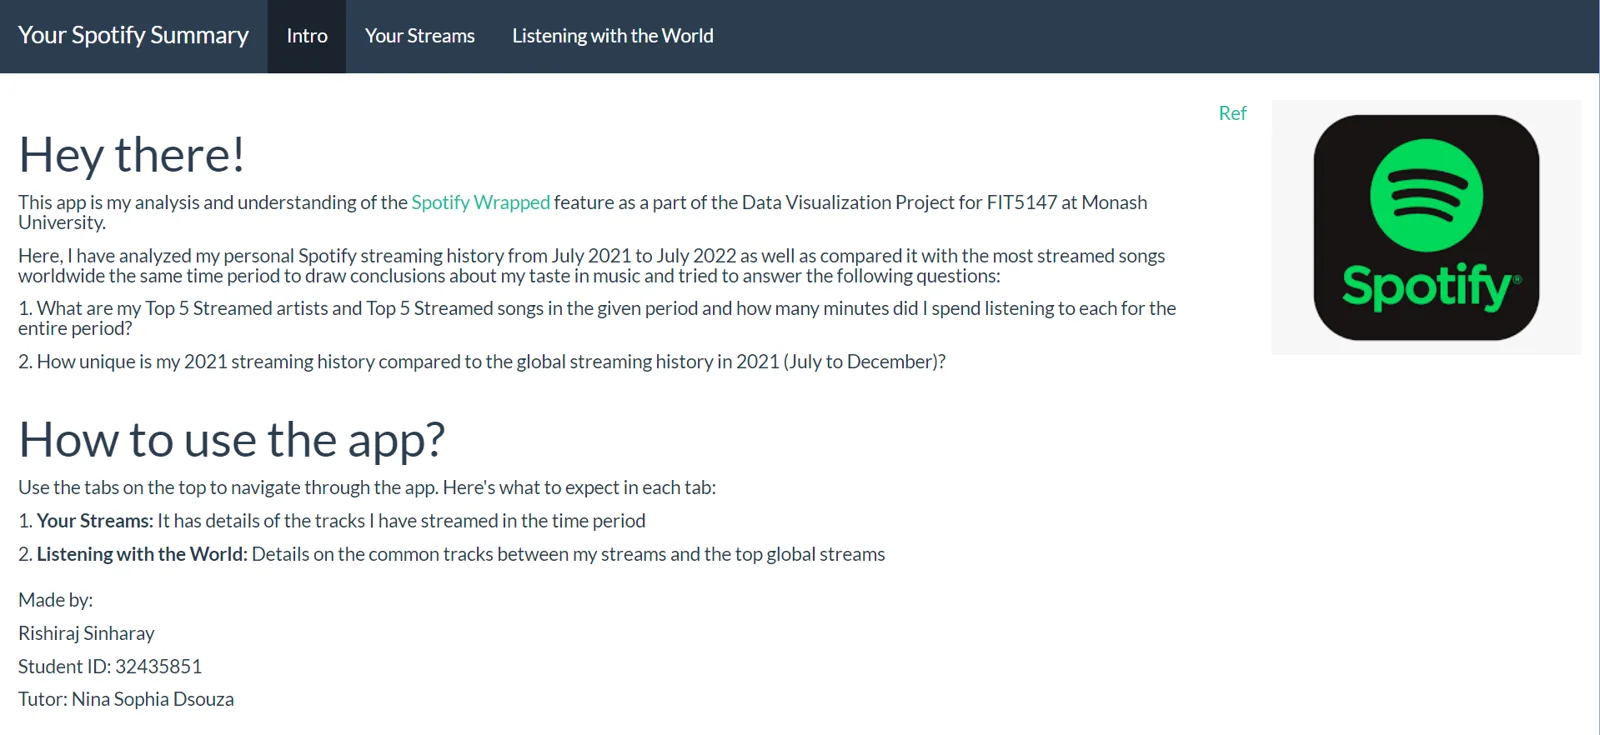
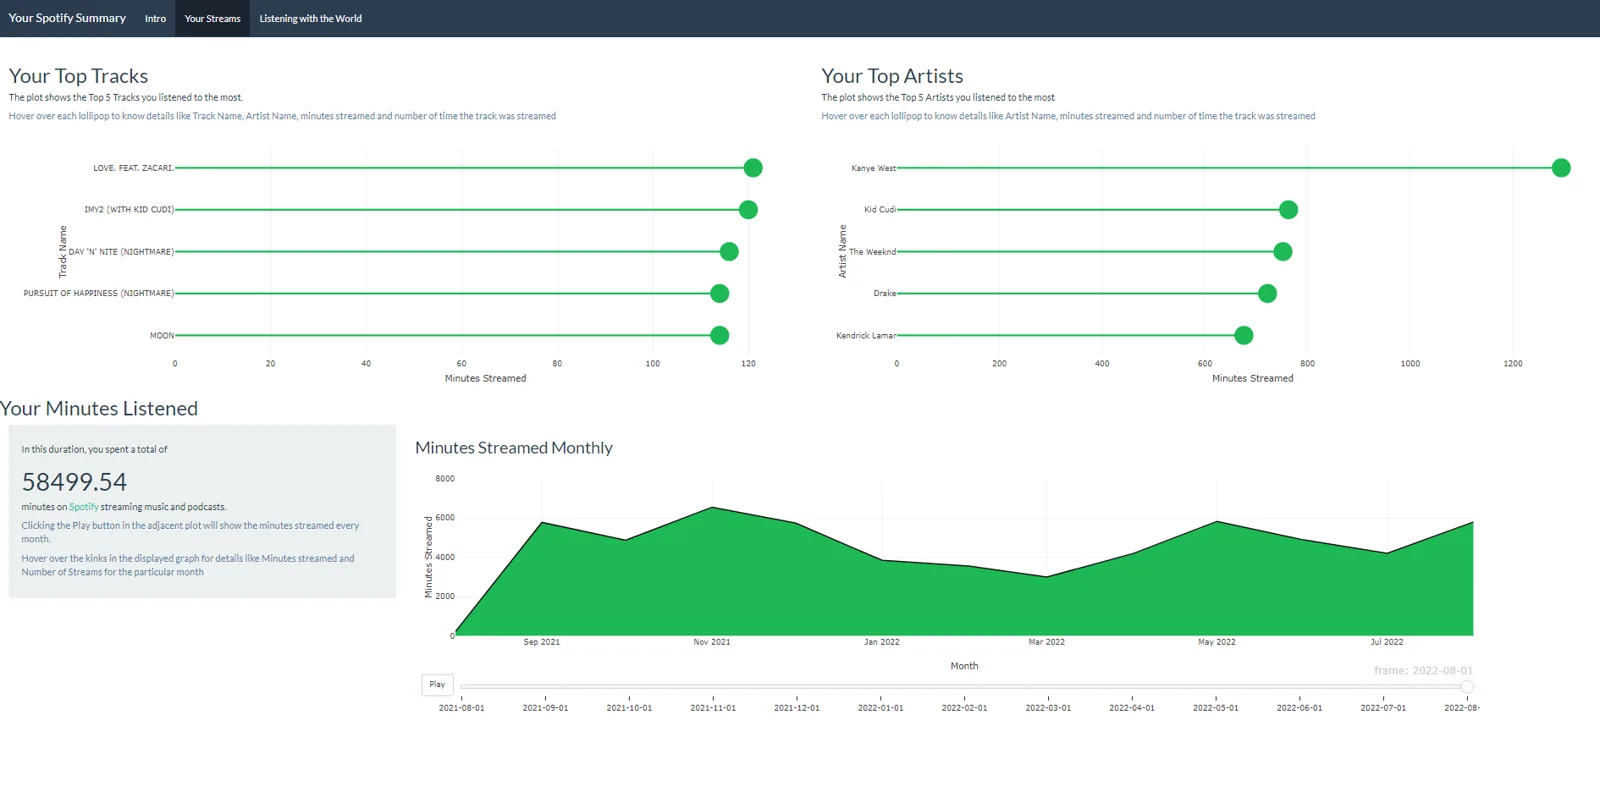
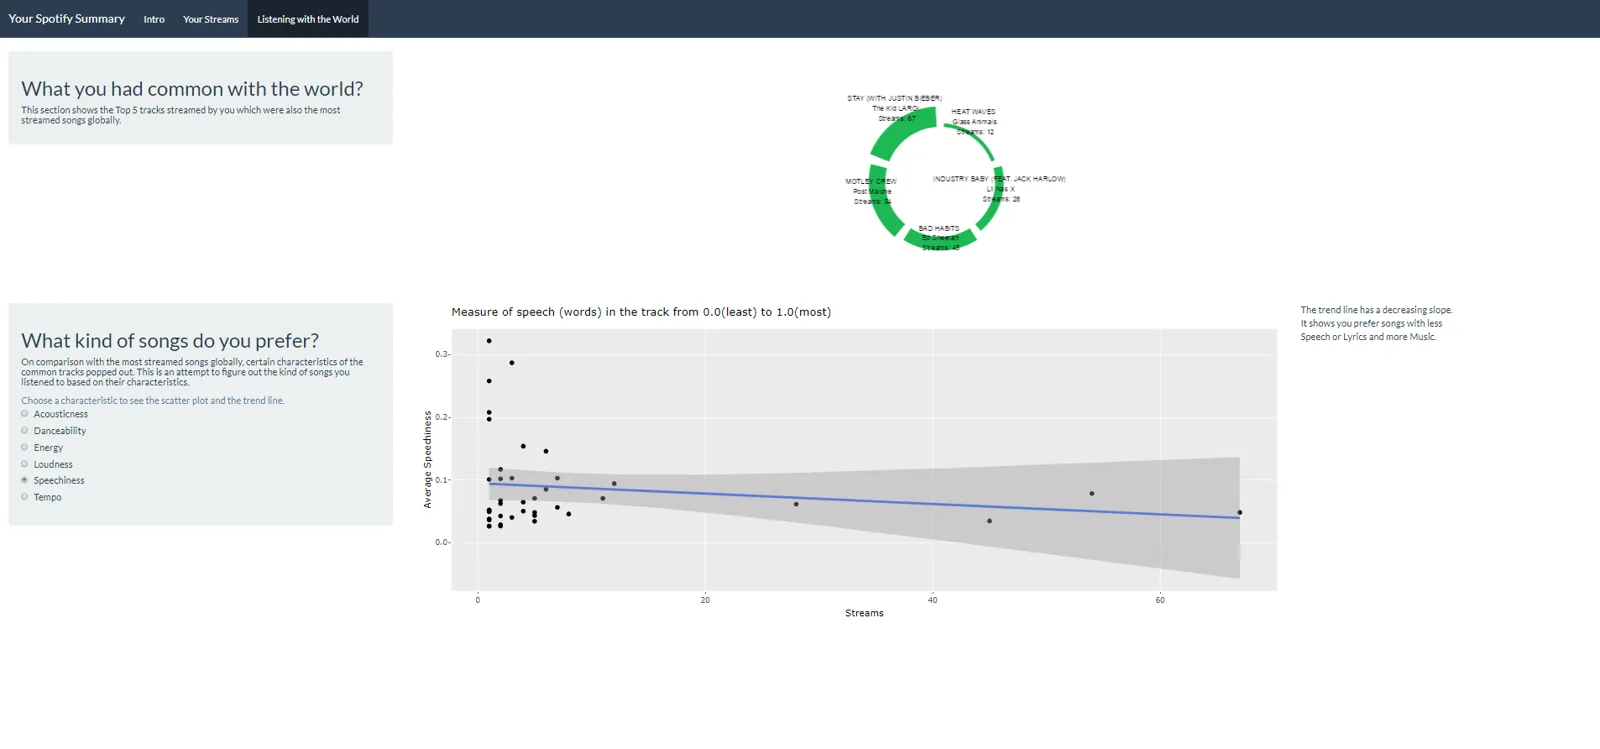
This project is a deep dive into personal Spotify streaming data from July 2021 to July 2022, inspired by Spotify's marketing campaign, Spotify Wrapped. The project focuses on making a dashboard visualizing streaming habits, comparing them with global trends, and answering specific questions about top artists and tracks over the year. This project was carried out on R Shiny.
Research, 2022
Spotify Streaming Data Analysis
- Stack
- Exploratory Data Analysis, Data Visualization, R programming
- Organisation
- Monash University
- Date
- October, 2022
- Tutor
- Nina Sophia Dsouza